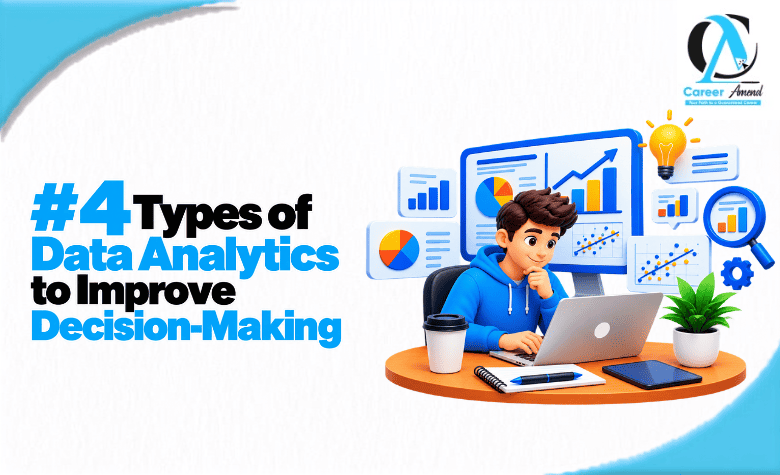
4 Types of Data Analytics to Improve Decision-Making
- What do you understand by Data Analytics?
- What is the importance of understanding the 4 types of data analytics?
- 1. Descriptive Analytics: It tells you what happened.
- 2. Diagnostic Analytics: It tells you why it happened.
- 3. Predictive Analytics: It tells what might happen
- 4. Prescriptive Analytics: It tells you what you should do.
- How do all types of data analytics work together?
- What is the brief difference between the 4 types of data analytics?
- Build Your Data Science and Analytics Skills
- Conclusion:
Every business makes choices all day long. What should we sell more of? Why did sales drop last month? Which customers might leave soon? Good answers come from data, and the way you study that data matters. In this guide, you will learn the four types of data analytics, what each one does, and how each one helps you make smarter choices. We will keep the words simple and the examples real.
What do you understand by Data Analytics?
Data analytics means looking at information to find useful answers. The information can be sales numbers, website visits, customer feedback, or machine readings. Analysts clean the data, study it for patterns, and turn it into facts that people can act on.
Think of it like cooking. Raw data is like raw food. It is hard to use as it is. Analytics is the cooking that turns it into a meal you can actually enjoy and use.
Not all analytics answers the same question. Some methods tell you what already happened. Others tell you why it happened, what may happen next, or what you should do about it. That is where the four types come in.
What is the importance of understanding the 4 types of data analytics?
Research firm Gartner shared a well-known model in the early 2010s that sorts analytics into four levels: descriptive, diagnostic, predictive, and prescriptive. Many schools, training programmes, and companies still use this model today because it is easy to follow.
Each level answers a different question:
- Descriptive: What happened?
- Diagnostic: Why did it happen?
- Predictive: What is likely to happen next?
- Prescriptive: What should we do about it?
Knowing the types of data analytics helps you pick the right tool for the right question. If you only look at last month's numbers, you may miss the reason behind them. If you try to predict the future without understanding the past, your guesses may be weak. Using the right level at the right time leads to better, calmer, and more confident decisions.
1. Descriptive Analytics: It tells you what happened.
Descriptive analytics is the starting point. It looks at past data and summarises it in a clear way. It does not explain why something happened. It simply shows you the facts.
How it works. Analysts collect data, add it up, and show it in reports, tables, charts, or dashboards. Common methods include totals, averages, percentages, and simple comparisons over time.
Simple example. Imagine a bakery owner who checks the weekly sales report. It shows that the shop sold 400 loaves of bread last week and 350 the week before. That is descriptive analytics. The owner now knows what happened.
Common uses:
- Monthly sales and revenue reports
- Website traffic summaries
- Customer counts and sign-up numbers
- Key performance indicators, often called KPIs
- Financial statements that show profit and costs
Why it helps decisions. Descriptive analytics gives you a clear picture of where you stand. You cannot fix a problem or grow a strength if you do not know the facts first. It is also the easiest level to begin with, since many teams already track basic numbers.
Limits to remember. It tells you what, but not why. A chart can show that sales fell, but it cannot tell you the cause. That is the job of the next level.
2. Diagnostic Analytics: It tells you why it happened.
Diagnostic analytics goes one step deeper. It also uses past data, but it digs in to find causes. Its main goal is to find the root cause of a result.
How it works. Analysts compare groups, look for links between factors, and break the numbers into smaller parts. For example, they may split total sales by region, product, or day of the week. Methods include drilling down into the data, comparing time periods, and checking how two things move together.
Simple example. Back to our bakery. The owner sees that Saturday sales dropped. A closer look shows that the drop happened only at the shop near the school and that the school was closed for a holiday. Now the owner knows the reason, and it is not a real problem.
Common uses:
- Finding why a website lost visitors
- Understanding why customers cancel a service
- Tracing a rise in product returns to a certain batch or supplier
- Checking why one store performs better than another
- Finding the cause of a sudden jump in costs
Why it helps decisions. Without the cause, people often guess, and guesses can lead to costly mistakes. If the owner had thought the bread was bad, they might have changed the recipe for no reason. Diagnostic work prevents that kind of wrong turn.
A caution. Two things happening together do not always mean one caused the other. For example, ice cream sales and sunburns both rise in summer, but ice cream does not cause sunburn. Good analysts test their ideas before they call something a cause.
3. Predictive Analytics: It tells what might happen
Predictive analytics looks forward. It uses past data, math, and often machine learning to estimate what may happen next. The key word is may. These are smart estimates, not promises.
How it works. Analysts build a model, which is a set of rules the computer learns from old data. The model finds patterns and uses them to forecast new results. Common tools include statistical forecasting and machine learning models.
Simple example. The bakery owner notices that sales go up before holidays and during warm weekends. A forecast built from several years of sales can estimate how many loaves to bake next Friday. That means less bread wasted and fewer empty shelves.
Common uses:
- Forecasting sales and demand
- Spotting customers who may leave soon
- Flagging card payments that look unusual to help catch fraud
- Estimating when a machine may need repair
- Predicting which students may need extra help
Why it helps decisions. Predictive analytics lets you prepare before a problem or chance arrives. You can order the right amount of stock, plan staff schedules, or reach out to a customer before they leave.
Limits to remember. A forecast is only as good as its data. If the data is old, incomplete, or biased, the prediction can be wrong. Also, sudden events, like a storm or a new competitor, can change things in ways the model did not see coming. Good teams check their forecasts against real results and update them often.
4. Prescriptive Analytics: It tells you what you should do.
Prescriptive analytics is the most advanced of the four. It does not stop at predicting. It suggests the best action to take. It builds on the first three types and often uses optimisation methods and machine learning.
How it works. The system tests many possible choices, estimates the result of each one, and recommends the option that best meets a goal, such as lower cost or faster delivery. It also respects limits, such as budget, time, or the number of workers.
Simple example. A GPS app is a good picture of this idea. It looks at the roads, checks traffic, predicts travel times, and then tells you which route to take. It does not just say "traffic is heavy". It tells you what to do.
For the bakery, a prescriptive tool might suggest how many loaves to bake at each shop, and when, to keep waste low while avoiding sold-out shelves.
Common uses:
- Choosing the fastest delivery routes
- Setting staff schedules that match busy times
- Suggesting the best price for a product
- Deciding how to split a budget across advertising channels
- Managing stock levels across many stores
Why it helps decisions. It turns insight into action. Instead of staring at charts and wondering what to do next, teams get clear options with the likely result of each.
Limits to remember. This type is usually the hardest and most costly to build. It needs good data, clear goals, and skilled people. It also works best when humans review the advice. A tool may not know about a local event or a sudden change, so people should stay in charge of the final call.
How do all types of data analytics work together?
These four levels are not rivals. They build on each other like steps on a staircase.
- Descriptive analytics shows that sales dropped.
- Diagnostic analytics finds out why.
- Predictive analytics estimates what will happen if nothing changes.
- Prescriptive analytics suggests the best action to fix it.
Most teams start at the bottom and climb up as their data and skills grow. This path is often called analytics maturity. You do not need to rush to the top. A small shop that uses simple reports well can make better decisions than a large firm with fancy tools it does not understand.
What is the brief difference between the 4 types of data analytics?
Here is an easy way to remember the differences:
- Descriptive: Looks at the past. Gives facts. Example: last month's sales report.
- Diagnostic: Looks at the past. Gives reasons. Example: finding why sales fell in one region.
- Predictive: Looks ahead. Gives estimates. Example: forecasting next month's demand.
- Prescriptive: Looks ahead. Gives advice. Example: recommending the best delivery route.
Build Your Data Science and Analytics Skills
Learn how data is collected, analysed and used to support business decisions. Explore the Data Science Course at Learning Saint to develop your understanding of data analysis, statistical concepts and practical applications.
Conclusion:
The four types of data analytics each answer a different question. Descriptive analytics tells you what happened. Diagnostic analytics explains why. Predictive analytics estimates what may come next. Prescriptive analytics suggests what to do about it. Together, they move a team from simply looking at numbers to taking smart action.
You do not need advanced tools to begin. Start with a clear question, use clean data, and build step by step. Over time, understanding these types of data analytics will help you make choices that are clearer, faster, and better supported by facts.
Frequently Asked Questions